Introduction
ARIS Web Position Sensor (WPS) can use either infrared (IR) light or white light (WL) to detect the position of a web material. As a contrast sensor ARIS WPS with WL option can detect visible contrasts on the web. The revolutionary sensor technology is based on spatial filtering of light to accurately determine the position of a contrast edge or line on the web material, irrespective of the material properties. This sensing principle is unique and provides a true, absolute position measurement.
The working principle of the sensor is as follows. Light from an array of white LEDs is projected on to the web surface. The light that intercepts the web get scattered in all direction and this scattered light is spatially filtered using the fiber optic array within the sensor. The filtered light is then projected onto a camera sensor. The position of the edge, which is defined by the contrast between the two web layers, is determined by processing the output of the camera sensor using sophisticated digital signal processing algorithms in real-time. The algorithm automatically adjusts for the contrasts and is unaffected by the ambient lighting conditions. Essentially the sensor calibrates itself continuously.
Contrast Sensor Specification
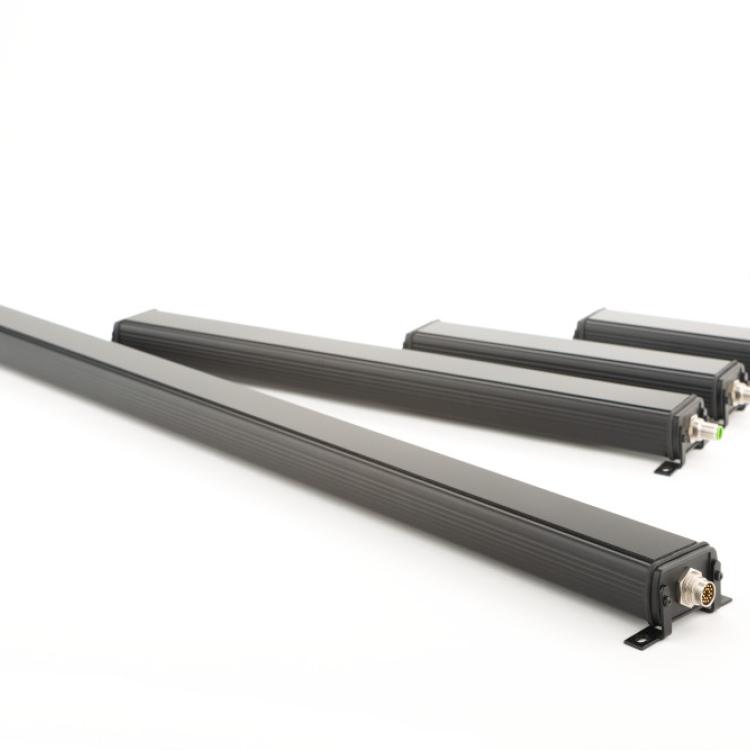
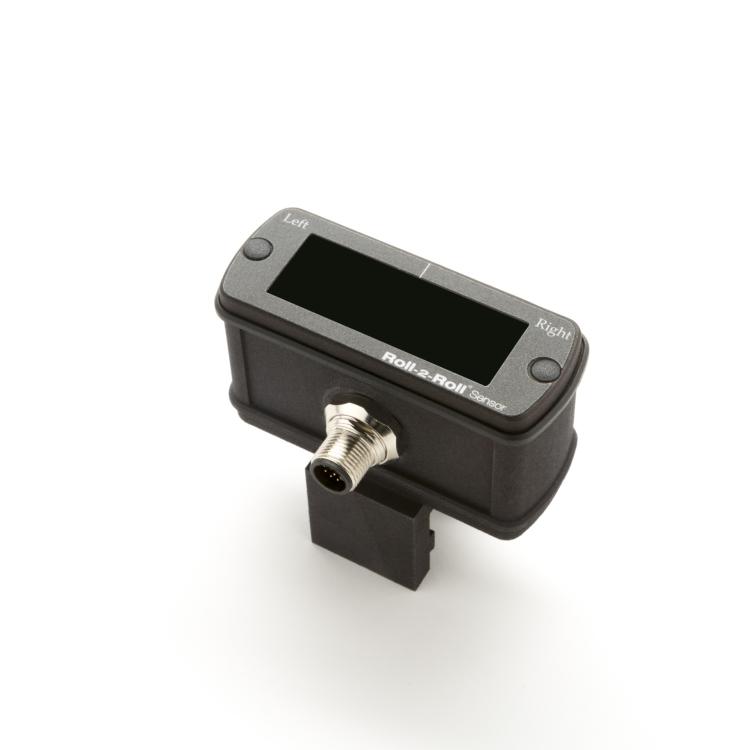
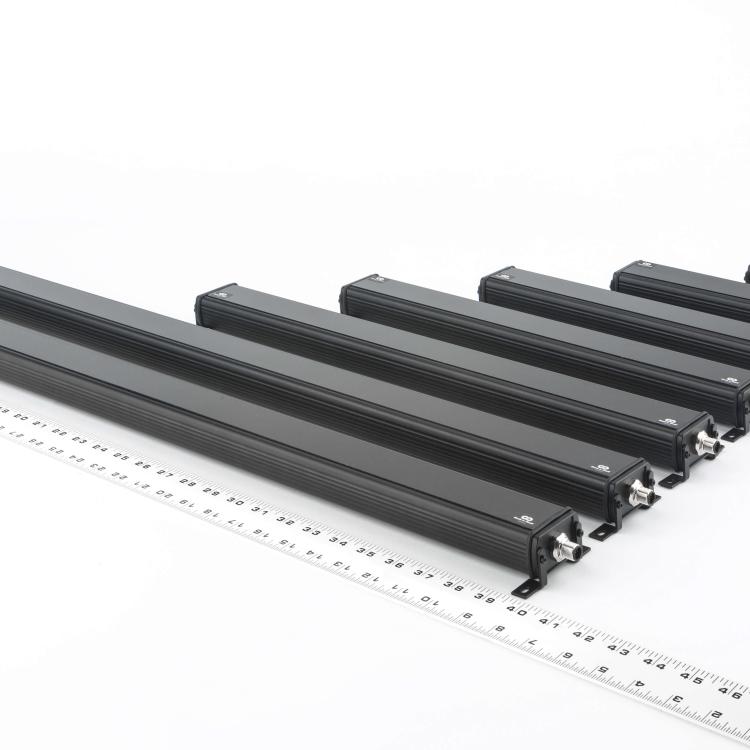
Three sensor widths that are currently available with the WL option include 16 mm, 48 mm and 221 mm. The sensor head includes a light diffuser, a spatial optical filter, a 1D camera sensor and white LED light source. Depending on the width, the 1D camera sensor resolution is either 63.5 micron or 125 micron. The image captured by the 1D camera sensor is transferred to a dedicated sensor processing unit to compute the output. Up to 10 m long cable can be used with the sensor head enabling remote installation of the sensor head from the sensor processing unit.
Contrast Sensor Performance: Experimental Procedure
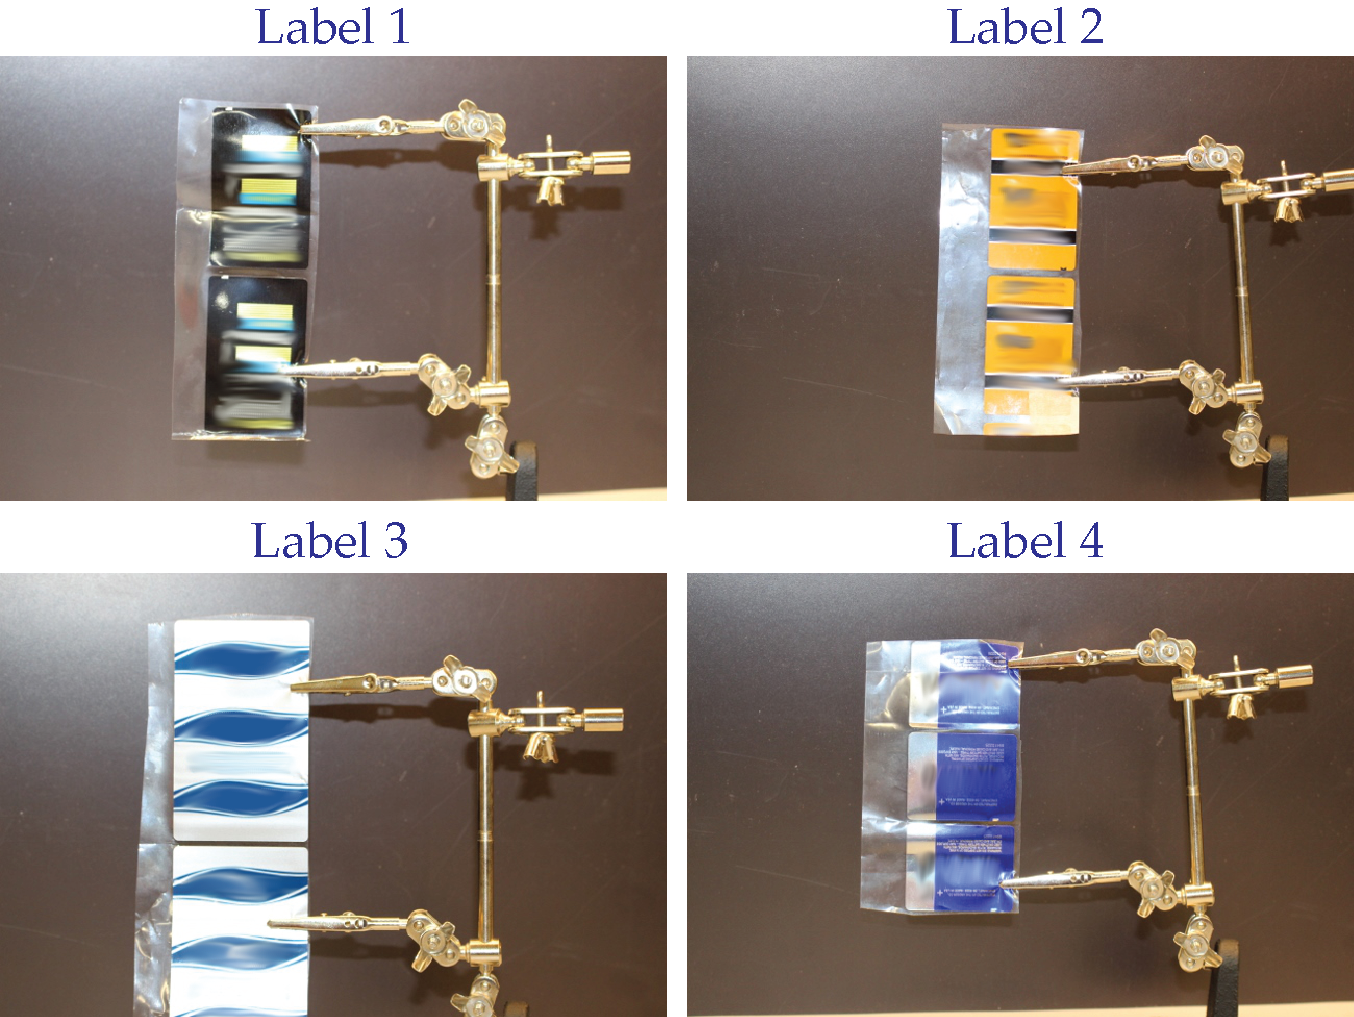
In this white paper, we shown experiments with four types of composite webs with different substrates (see Fig. 1) to highlight the contrast sensor's ability to work with different materials with different contrast properties. The composite web consists of a clear carrier film that supports the printed label web. Three substrates with varied optical properties are used for the printed label web. These substrates are white, metallic and clear. The printing on the four labels are also different and the contrast between different labels are substantially different. The contrast sensor measures the position of the die cut edge of the label. The contrast difference between the clear carrier film and the printed label substrate is the edge of interest. Common issues with these substrates on a clear carrier film are mainly the low contrast levels between the substrate, the contrast difference within the labels and the carrier film, and the reflective properties of the substrate. The experimental results show the effectiveness of the signal processing algorithm to overcome these limitations.
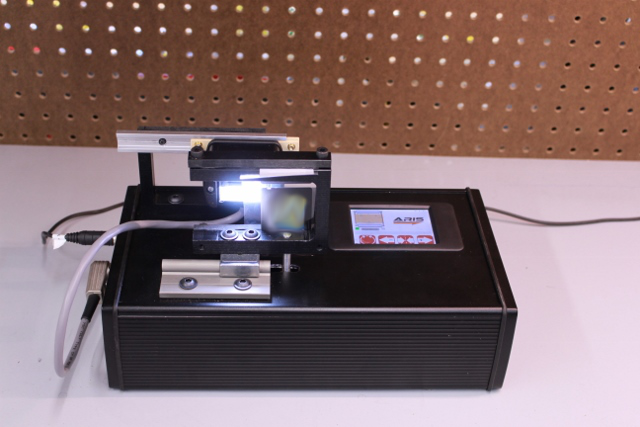
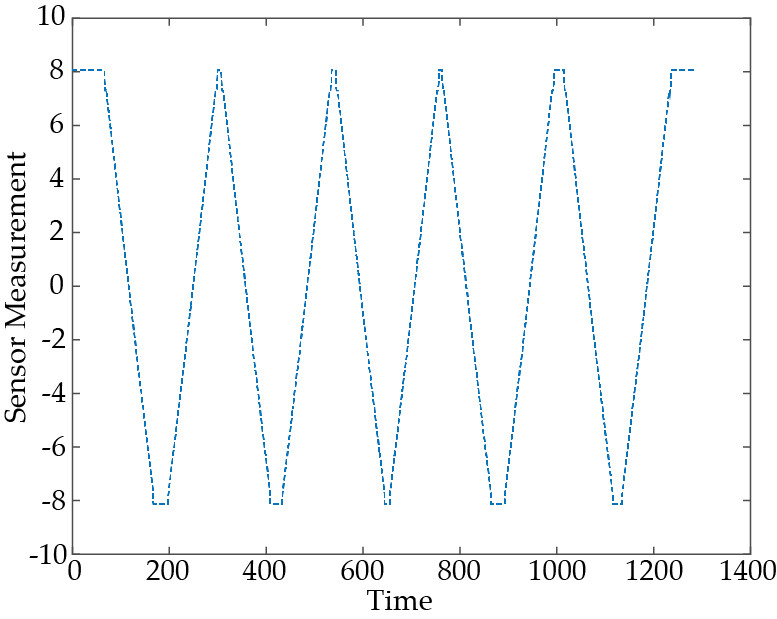
An experimental setup (see Fig. 2), equipped with a high precision motor stage which moves the web material back and forth, is used to quantify the sensor performance. For each set of experiments with each sample, the web on the motor stage is moved back and forth (as shown in Fig. 3) several times during a experiment while the motor position data and sensor edge position data are recorded.
Contrast Sensor Performance: Experimental Results
Fig. 4 show representative sample of experimental results with 16 mm sensor for the four different samples. Six sets of data were collected by positioning the motor stage to move back and forth three times. The step size and the motor speed was chosen such that every single pixel is covered during every experiments. Data from all six experiments are superimposed into a single plot. The abscissa shows the web displacement measured using the motor position sensor and the ordinate shows the web edge measured using our sensor. Both the axes are represented in millimeters. The blue dots in the plots are the actual measured data and the red dashed line is the linear fit for each set of experiment. The table shows the parameters for the linear fit to the data from each experiment. All the experiments showed excellent precision, accuracy and linearity of the sensor (and the sensing principle) irrespective of the optical properties of the substrate. No calibration or any type of adjustment was made to the contrast sensor between any of these experiments. Moreover, the ambient light conditions did not affect the sensor accuracy, precision or linearity.
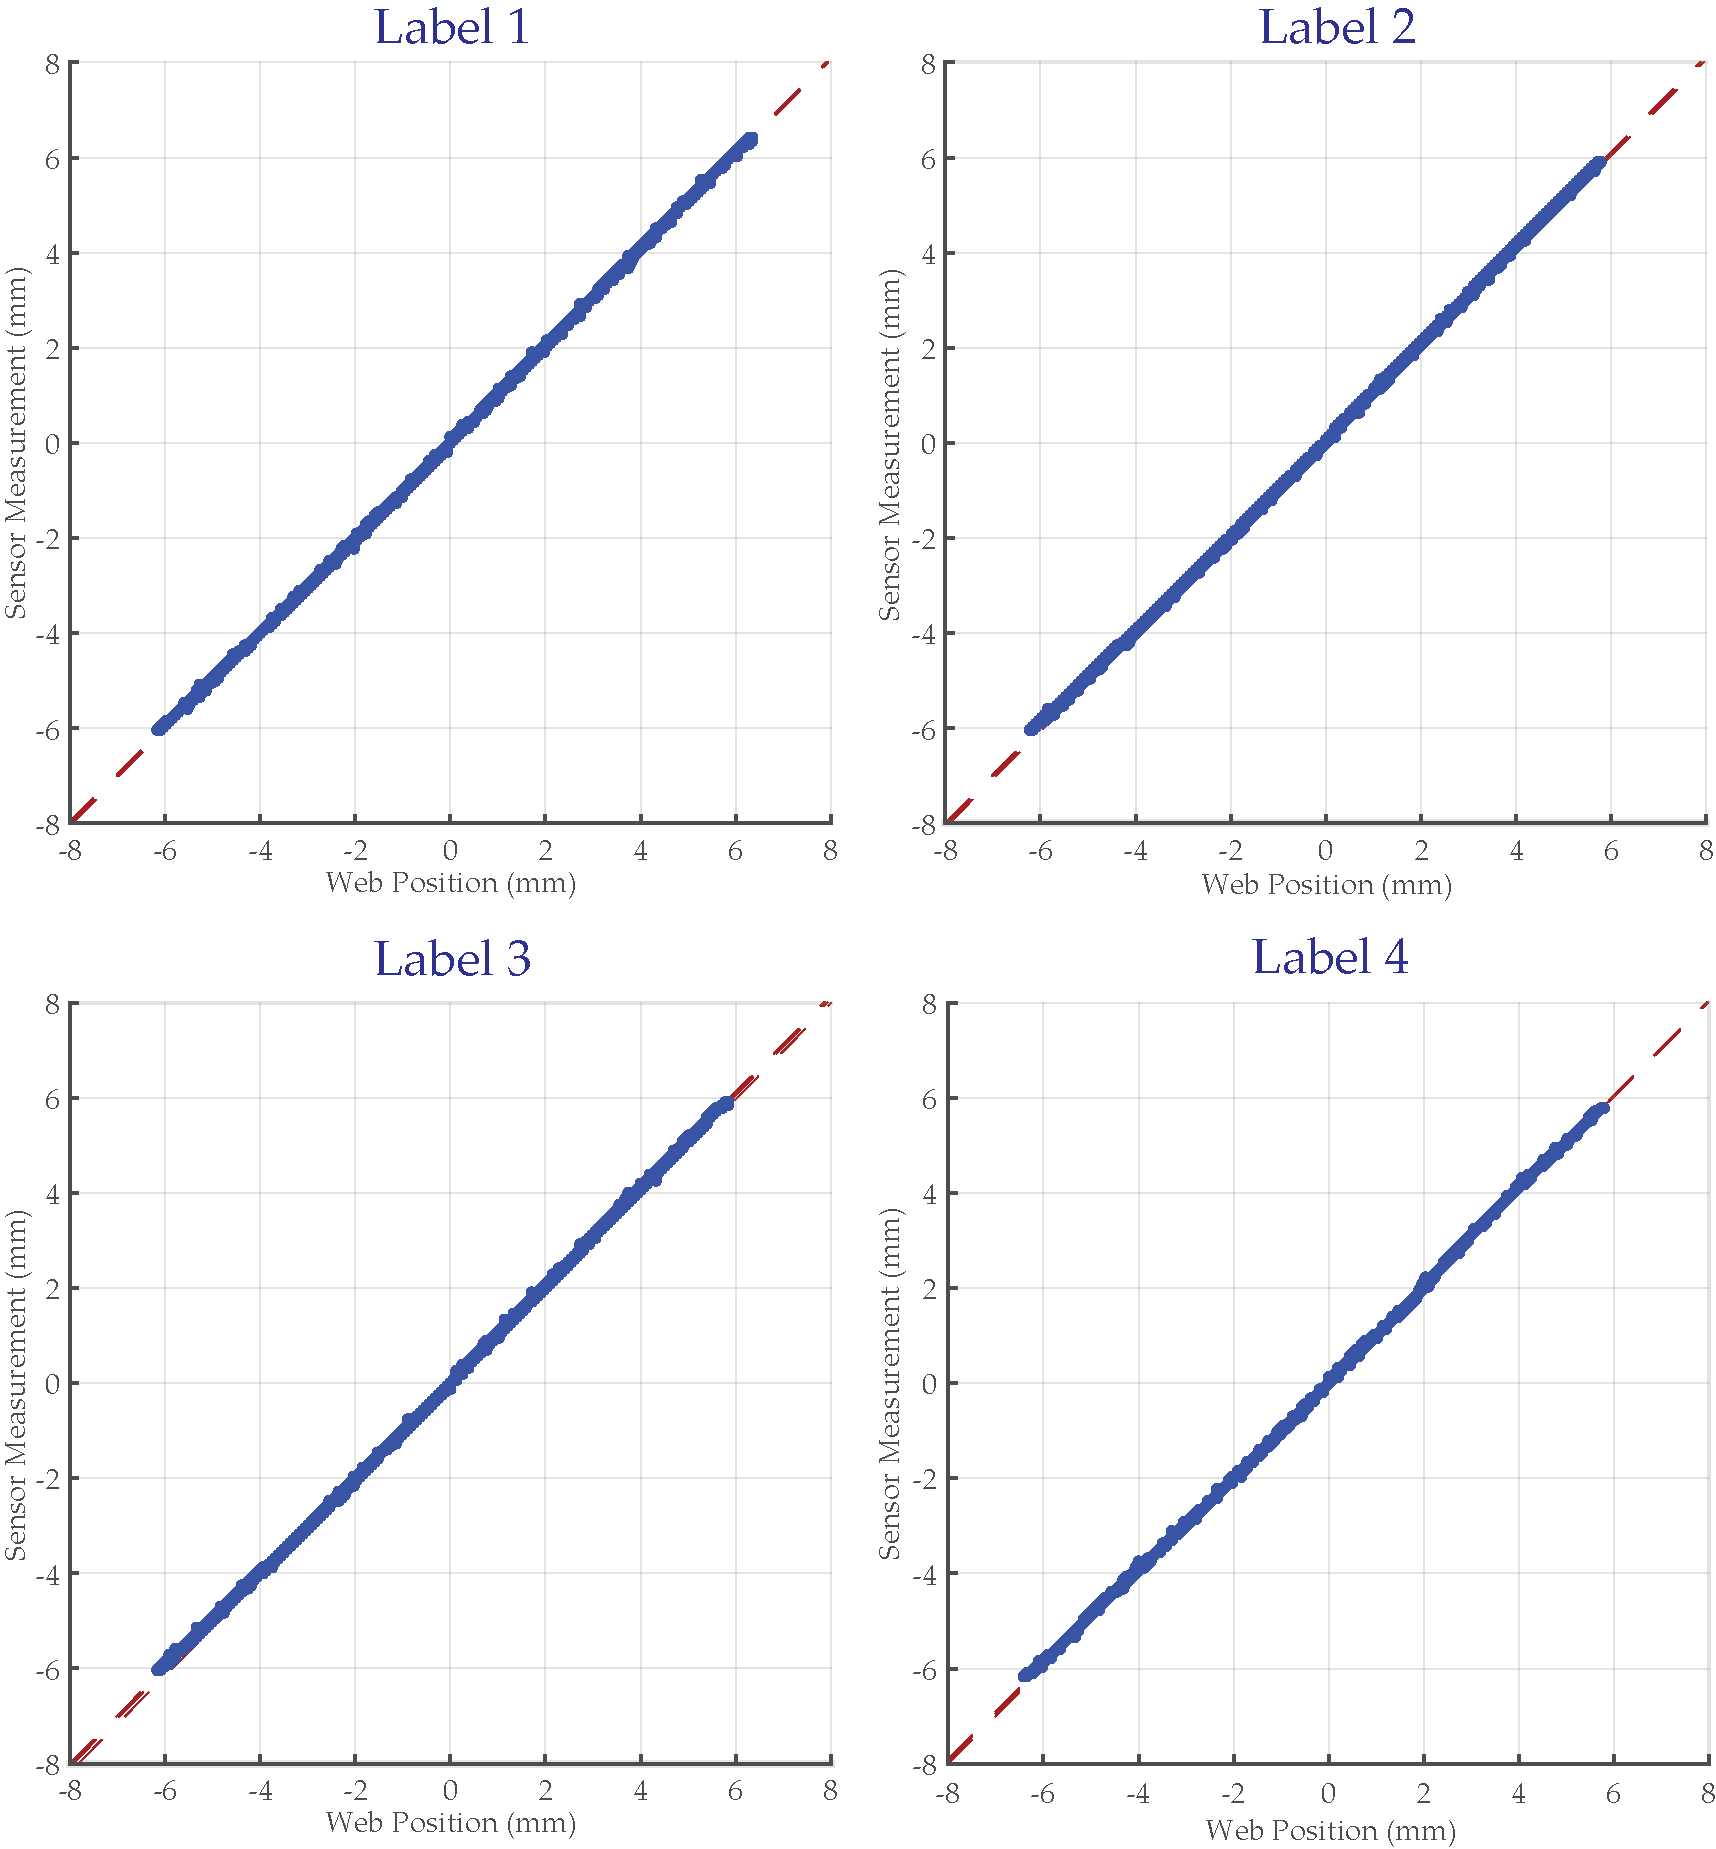
The slope, bias and linearity of the measurement for the four sample materials are summarized in the table below. The slope of the sensor measurement, which is within 0.2% of the ideal slope of 1, as well as the non-zero bias of the measurement clearly shows the exceptional accuracy of the sensing principle. Note that the bias value is less than the resolution of the sensor, which is 0.0635 mm, which indicate that the bias is also unaffected by the sensing principle. The R-squared value, the quantification of the goodness of the fit, is close to one which shows that the measurement is highly reliable, linear and unaffected by the material properties.
| Web Material | Slope | Bias (mm) | R-squared |
|---|---|---|---|
| Label 1 | 1.00484 | 0.04351 | 0.99962 |
| Label 2 | 1.00809 | 0.05035 | 0.99981 |
| Label 3 | 1.00961 | 0.01856 | 0.99982 |
| Label 4 | 0.99834 | 0.06170 | 0.99946 |
Conclusion
The experimental results show the accuracy and precision of the contrast sensor are unaffected by the material properties unlike conventional sensors. The contrast sensor accurately measures the edge position (defined by the contrast between the materials) irrespectively of the substrate and without need for any teaching procedures.
